I run the distributed lags and leads models
- I save a table for the models with 0, 1, 3, 7 lags
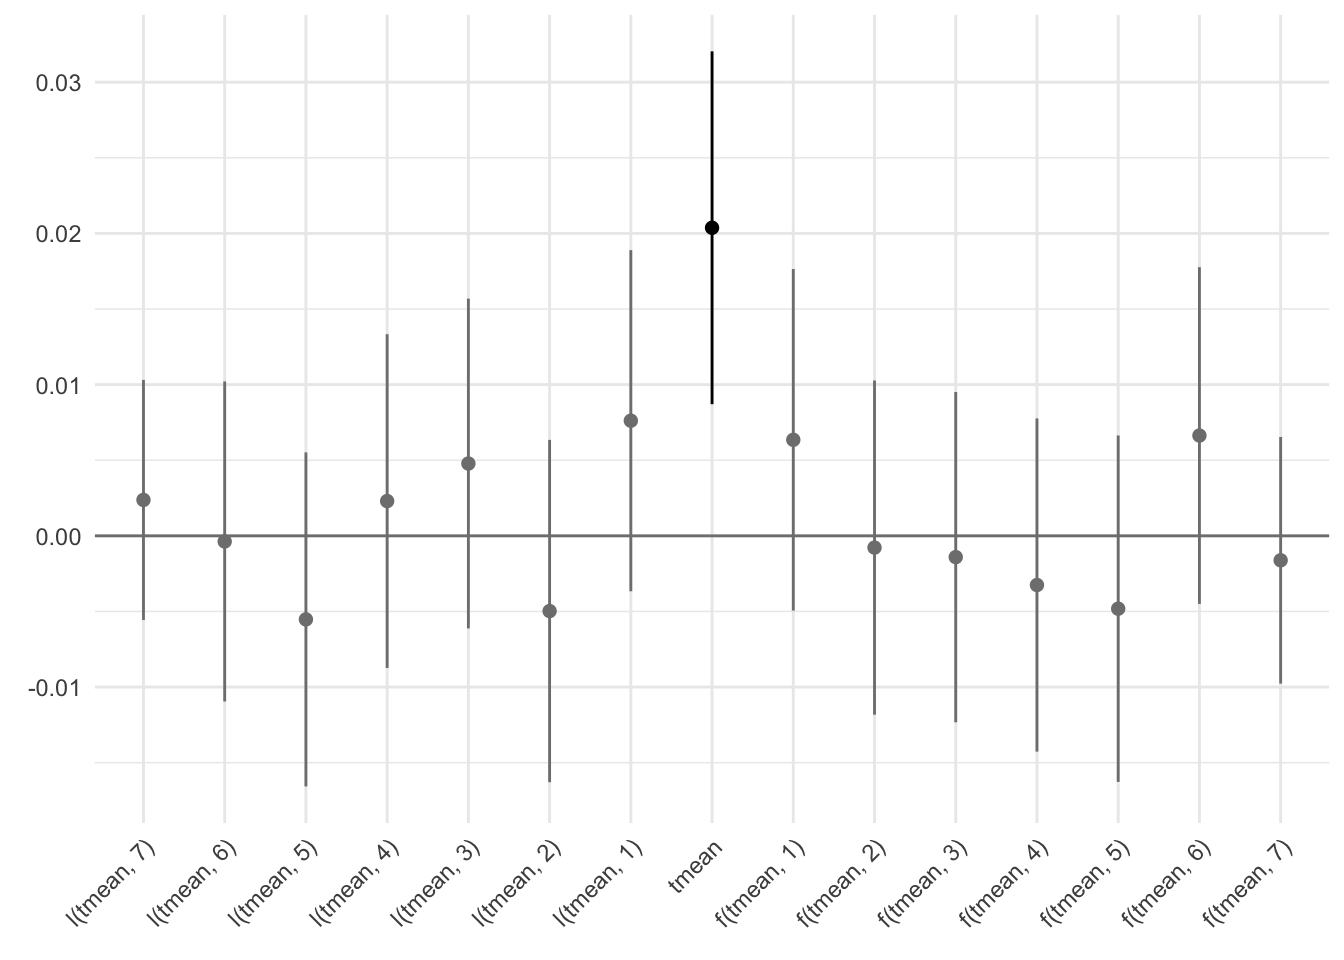
- I save a plot for the model with 7 leads and 7 lags
start_time <- Sys.time()

library(tidyverse)
library(here) # path control
library(fixest) # estimations with fixed effects
library(patchwork)
library(modelsummary) # for modelplot
library(knitr)
library(tictoc)
tic("Total render time")

source("fun_dynamic_bins.R")

mem.maxVSize(vsize = 40000)
data <-
  read_rds(here("..", "output", "data_reports.rds")) %>%
  filter(covid_phase == "Pre-pandemic")

data <- data %>%
  mutate(prec_quintile = ntile(prec, 5),
         rh_quintile = ntile(rh, 5),
         wsp_quintile = ntile(wsp, 5))
Lags
Run regressions with 0, 1, 3, and 7 days of lags.
I do it in separate commands, because all at once exhausts the memory.
# baseline for reference
reg_linear_reports <- data %>%
  fepois(reports_dv ~ tmean |
           prec_quintile + rh_quintile + wsp_quintile +
           ageb + year^month + day_of_week + day_of_year,
         cluster = ~ ageb)


reg_lags_1 <- data %>%
  fepois(reports_dv ~ l(tmean, 0:1) |
           prec_quintile + rh_quintile + wsp_quintile +
           ageb + year^month + day_of_week + day_of_year,
         panel.id = ~ ageb + date,
         cluster = ~ ageb)

reg_lags_3 <- data %>%
  fepois(reports_dv ~ l(tmean, 0:3) |
           prec_quintile + rh_quintile + wsp_quintile +
           ageb + year^month + day_of_week + day_of_year,
         panel.id = ~ ageb + date,
         cluster = ~ ageb)

reg_lags_7 <- data %>%
  fepois(reports_dv ~ l(tmean, 0:7) |
           prec_quintile + rh_quintile + wsp_quintile +
           ageb + year^month + day_of_week + day_of_year,
         panel.id = ~ ageb + date,
         cluster = ~ ageb)

# reg_lags_14 <- data %>%
#   fepois(reports_dv ~ l(tmean, 0:14) |
#            prec_quintile + rh_quintile + wsp_quintile +
#            ageb + year^month + day_of_week + day_of_year,
#          panel.id = ~ ageb + date,
#          cluster = ~ ageb)


etable(reg_linear_reports, reg_lags_1, reg_lags_3, reg_lags_7) %>%
  kable()
| Dependent Var.: |
reports_dv |
reports_dv |
reports_dv |
reports_dv |
|
|
|
|
|
| tmean |
0.0274*** (0.0034) |
0.0234*** (0.0046) |
0.0236*** (0.0047) |
0.0237*** (0.0047) |
| l(tmean,1) |
|
0.0051 (0.0041) |
0.0073 (0.0056) |
0.0078 (0.0056) |
| l(tmean,2) |
|
|
-0.0060 (0.0056) |
-0.0063 (0.0057) |
| l(tmean,3) |
|
|
0.0059 (0.0041) |
0.0058 (0.0055) |
| l(tmean,4) |
|
|
|
0.0026 (0.0056) |
| l(tmean,5) |
|
|
|
-0.0041 (0.0056) |
| l(tmean,6) |
|
|
|
-0.0006 (0.0054) |
| l(tmean,7) |
|
|
|
0.0019 (0.0040) |
| Fixed-Effects: |
—————— |
—————— |
—————— |
—————— |
| prec_quintile |
Yes |
Yes |
Yes |
Yes |
| rh_quintile |
Yes |
Yes |
Yes |
Yes |
| wsp_quintile |
Yes |
Yes |
Yes |
Yes |
| ageb |
Yes |
Yes |
Yes |
Yes |
| year-month |
Yes |
Yes |
Yes |
Yes |
| day_of_week |
Yes |
Yes |
Yes |
Yes |
| day_of_year |
Yes |
Yes |
Yes |
Yes |
| _______________ |
__________________ |
__________________ |
__________________ |
__________________ |
| S.E.: Clustered |
by: ageb |
by: ageb |
by: ageb |
by: ageb |
| Observations |
3,624,826 |
3,622,403 |
3,617,557 |
3,607,865 |
| Squared Cor. |
0.01333 |
0.01333 |
0.01333 |
0.01334 |
| Pseudo R2 |
0.05612 |
0.05611 |
0.05611 |
0.05612 |
| BIC |
804,221.2 |
803,728.4 |
803,021.8 |
801,530.6 |
I register an extraline in fixest to compute cumulative effect, and export the reg table as reg_lags.tex
Lags and leads
Run a model with 7 leads and 7 lags:
reg_leads_lags <- data %>%
  fepois(reports_dv #reports_dv_day
         ~ f(tmean, -7:7) |
           prec_quintile + rh_quintile + wsp_quintile +
           ageb + year^month + day_of_week + day_of_year,
         panel.id = ~ ageb + date,
         cluster = ~ ageb)
Plot and save as reg_lags_leads.png
Rendered on: 2025-07-27 01:52:24
Total render time: 635.696 sec elapsed