start_time <- Sys.time()

library(tidyverse)
library(here) # path control
library(fixest) # estimations with fixed effects
library(modelsummary) # for the modelplot figure
library(patchwork)
library(knitr)
library(tictoc)
tic("Total render time")

source("fun_dynamic_bins.R")Helpline calls
Note
I run all the regressions on call data here.
- I save the plot of the non-linear estimates.
- I don’t export the table bc its only one coeff.
- I try to run the linear model on calls for different forms of DV, but not very successful, I don’t export the table.
data <-
  read_rds(here("..", "output", "data_calls.rds")) %>%
  filter(covid_phase == "Pre-pandemic")

data <- data %>%
  mutate(prec_quintile = ntile(prec, 5),
         rh_quintile = ntile(rh, 5),
         wsp_quintile = ntile(wsp, 5))

# baseline for reference
# reg_linear_reports <- data %>%
#   fepois(reports_dv ~ tmean |
#            prec_quintile + rh_quintile + wsp_quintile +
#            ageb + year^month + day_of_week + day_of_year,
#          cluster = ~ ageb)
Linear effects
reg_linear_calls <- data %>%
  fepois(calls ~ tmean |
           prec_quintile + rh_quintile + wsp_quintile +
           col_id + year^month + day_of_week + day_of_year,
         cluster = ~ col_id)

etable(reg_linear_calls) %>% kable()| reg_linear_calls | |
|---|---|
| Dependent Var.: | calls |
| tmean | 0.0307*** (0.0077) |
| Fixed-Effects: | —————— |
| prec_quintile | Yes |
| rh_quintile | Yes |
| wsp_quintile | Yes |
| col_id | Yes |
| year-month | Yes |
| day_of_week | Yes |
| day_of_year | Yes |
| _______________ | __________________ |
| S.E.: Clustered | by: col_id |
| Observations | 1,533,569 |
| Squared Cor. | 0.05630 |
| Pseudo R2 | 0.16593 |
| BIC | 243,529.3 |
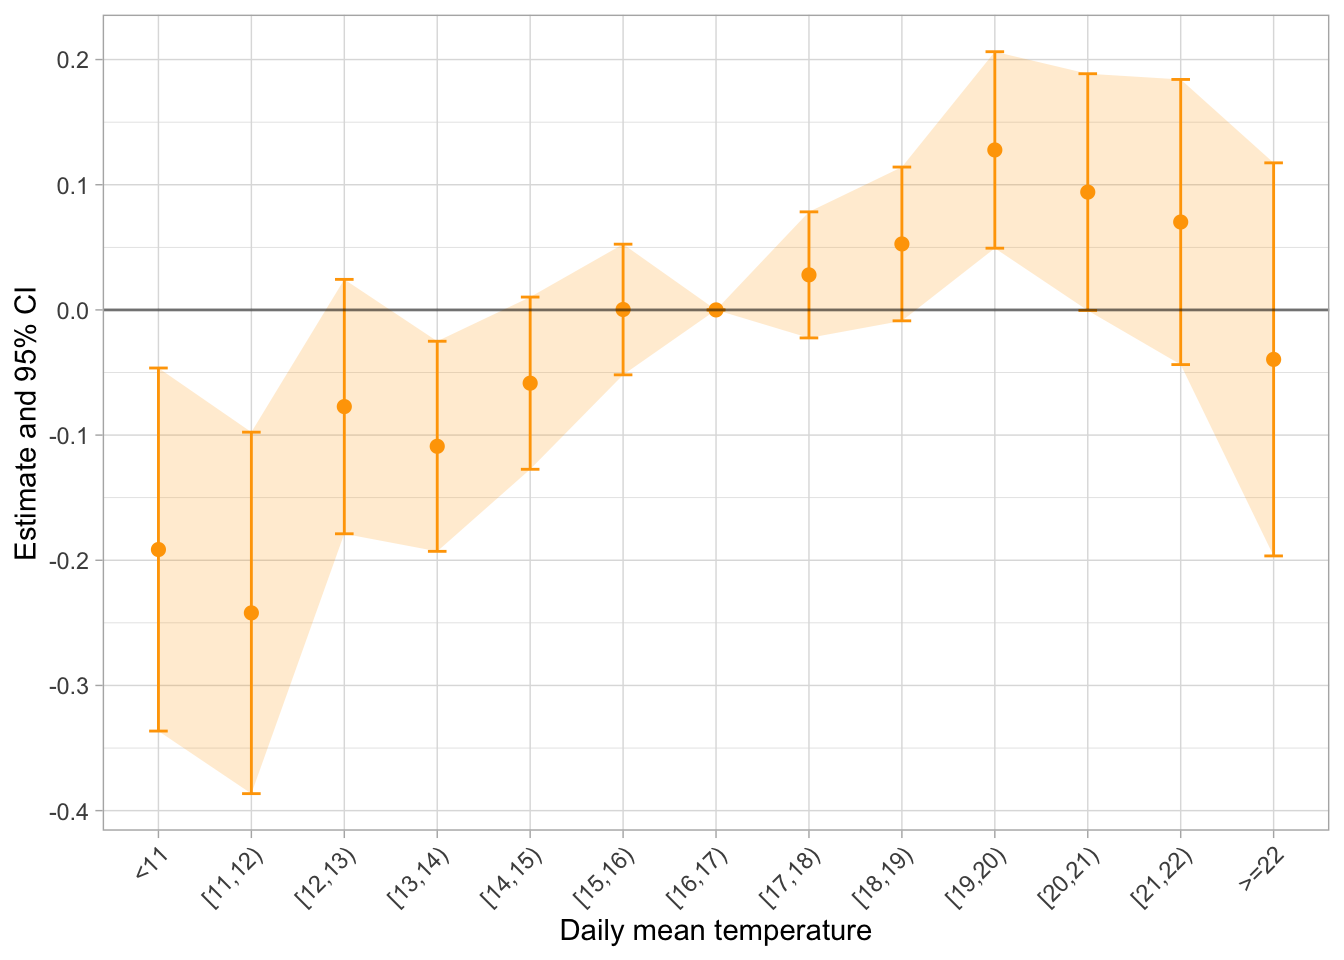
Allowing for non-linearity
reg_bins_calls <- data %>%
  mutate(bins_tmean_one = create_dynamic_bins(tmean, width = 1, 0.01)) %>%
  fepois(calls ~ i(bins_tmean_one, ref = "[16") |
           prec_quintile + rh_quintile + wsp_quintile +
           col_id + year^month + day_of_week + day_of_year,
         cluster = ~ col_id)
Plot and save as reg_bins_calls_1C.png
Linear model, by for different types of calls
Now, I estimate the linear model, but on a bunch of different LHS, such as calls_intimate partner violence, calls_violence against adult, calls_violence against children…
In theory interesting, but there are very few calls in each category and the measurement is sketchy…
# there are very few calls that are classed by we can try...
data %>%
  group_by(date) %>%
  select(starts_with("calls")) %>%
  summarise(across(starts_with("calls"), \(x) sum(x, na.rm = TRUE))) %>%
  ungroup() %>%
  summarise(across(starts_with("calls"), \(x) mean(x, na.rm = TRUE))) %>%
  pivot_longer(everything(), names_to = "type", values_to = "daily_mean") %>%
kable()| type | daily_mean |
|---|---|
| calls | 21.266445 |
| calls_hechos | 5.981682 |
| calls_usuaria | 20.188177 |
| calls_day | 15.169859 |
| calls_night | 6.096586 |
| calls_intimate partner violence | 4.313905 |
| calls_unknown | 8.585346 |
| calls_violence against adult | 4.616153 |
| calls_violence against children | 2.588676 |
| calls_violence committed by family members | 1.162365 |
reg_linear_calls_IPV <- data %>%
  rename(calls_IPV = `calls_intimate partner violence`) %>%
  fepois(calls_IPV ~ tmean |
           prec_quintile + rh_quintile + wsp_quintile +
           col_id + year^month + day_of_week + day_of_year,
         cluster = ~ col_id)

reg_linear_calls_adults <- data %>%
  rename(calls_adults = `calls_violence against adult`) %>%
  fepois(calls_adults ~ tmean |
           prec_quintile + rh_quintile + wsp_quintile +
           col_id + year^month + day_of_week + day_of_year,
         cluster = ~ col_id)

reg_linear_calls_children <- data %>%
  rename(calls_children = `calls_violence against children`) %>%
  fepois(calls_children ~ tmean |
           prec_quintile + rh_quintile + wsp_quintile +
           col_id + year^month + day_of_week + day_of_year,
         cluster = ~ col_id)

etable(reg_linear_calls,
       reg_linear_calls_IPV,
       reg_linear_calls_adults,
       reg_linear_calls_children) %>%
kable()| reg_linear_calls | reg_linear_ca.. | reg_linear_ca.. | reg_linear_cal.. | |
|---|---|---|---|---|
| Dependent Var.: | calls | calls_IPV | calls_adults | calls_children |
| tmean | 0.0307*** (0.0077) | 0.0221 (0.0166) | 0.0180 (0.0133) | 0.0470* (0.0189) |
| Fixed-Effects: | —————— | ————— | ————— | —————- |
| prec_quintile | Yes | Yes | Yes | Yes |
| rh_quintile | Yes | Yes | Yes | Yes |
| wsp_quintile | Yes | Yes | Yes | Yes |
| col_id | Yes | Yes | Yes | Yes |
| year-month | Yes | Yes | Yes | Yes |
| day_of_week | Yes | Yes | Yes | Yes |
| day_of_year | Yes | Yes | Yes | Yes |
| _______________ | __________________ | _______________ | _______________ | ________________ |
| S.E.: Clustered | by: col_id | by: col_id | by: col_id | by: col_id |
| Observations | 1,533,569 | 1,144,451 | 1,134,843 | 953,492 |
| Squared Cor. | 0.05630 | 0.01448 | 0.01516 | 0.00845 |
| Pseudo R2 | 0.16593 | 0.11416 | 0.11529 | 0.09899 |
| BIC | 243,529.3 | 78,055.0 | 81,178.9 | 54,476.0 |
Rendered on: 2025-07-27 01:54:59Total render time: 149.983 sec elapsed